
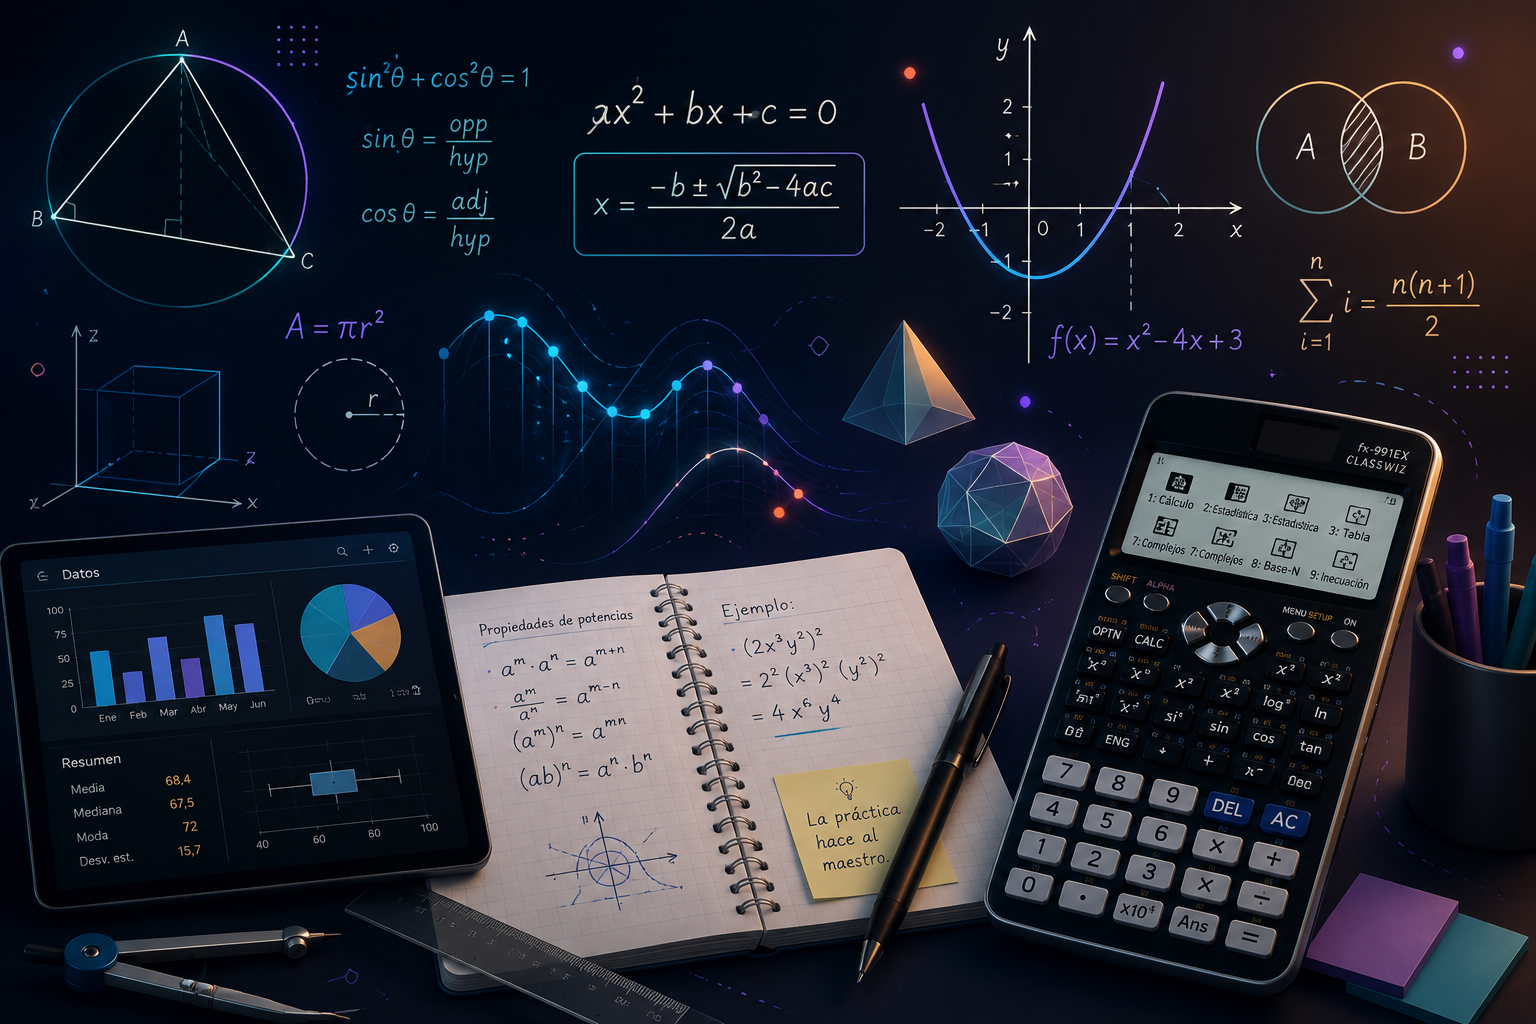
Welcome to the Data Literacy & Statistics module! In a world driven by information, understanding data is one of the most vital skills you can master.
In this course, you will step into the shoes of a data analyst—learning not just how to calculate numbers, but how to ask the right questions, uncover patterns, detect bias, and use evidence to make critical real-world decisions.
🚀 What You Will Learn
Data Foundations & Classification: Learn to categorize qualitative vs. quantitative data (nominal, ordinal, discrete, continuous) and structure raw information into frequency tables.
Sampling Bias: Differentiate between populations and samples, explore sampling methods (simple random, stratified, convenience), and critically evaluate data for sampling bias.
Measures of Central Tendency & Outliers: Master the mean, median, and mode while analyzing how extreme values (outliers) skew data representations and influence real-world reporting.
Data Visualization: Group continuous data into intervals to construct and interpret frequency tables, histograms, bar charts, and cumulative frequency plots.
Technology Integration: Transition from manual, pen-and-paper calculations to professional digital spreadsheet tools (Microsoft Excel and scientific calculators) to process, analyze, and graph large, complex datasets efficiently.
- Teacher: Juan Diego Arias Zuñiga